
This page covers everything you need to know about Properties in Sticklight, including both Calculated Properties and Magic Properties.
What are Properties?
// Fancy screenshot here Properties are specialized columns you create alongside your data to answer product questions and drive continuous discovery. They live within Views as your core tools for analysis and enrich your data for deeper understanding. Properties can be combined to build layered insights, allowing you to progressively refine your analysis.- Overview
- When to Use
Sticklight offers two types of Properties:
- Calculated Properties: Process and aggregate data using predefined functions
- Magic Properties: Use natural language and AI to create insights
Table of Contents
Calculated Properties
Calculated Properties are fundamental data analysis tools that process and aggregate any aspect of your data, including other Properties you have created.Creating a Calculated Property
- From your View, click “New Column” and select “Calculated”
- Name your property (e.g., “first_conversation_message”)
- Select the Source Column you wish to analyze (e.g., “message_content”)
- Select an Aggregation Function to apply to the Source Column (e.g., “First Value”)
- Optionally, define a filter to focus the calculation on a part of your data. For example, you might filter to only include messages in conversations that have more than 4 messages.
- Click “Create” to save your Property
first_conversation_message Property”
Common Use Cases
// TODO: Write real examples, not LLM-generated- Extract the first or last value in a sequence
- Calculate averages, sums, or counts across related data points
- Filter data to focus on specific segments
- Create derived metrics by combining multiple data points
Magic Properties ✨
Magic Properties leverage natural language and LLMs to create insightful new Properties without requiring technical knowledge of SQL or data analysis.What are Magic Properties?
Magic Properties allow you to explore your data using natural language instructions. Instead of defining complex calculations or writing code, you simply describe what you want to discover, and Sticklight uses AI to create the property for you. This approach is particularly powerful for extracting subjective insights, categorizing free-form text, and identifying patterns that would be difficult to express in traditional queries.Creating a Magic Property
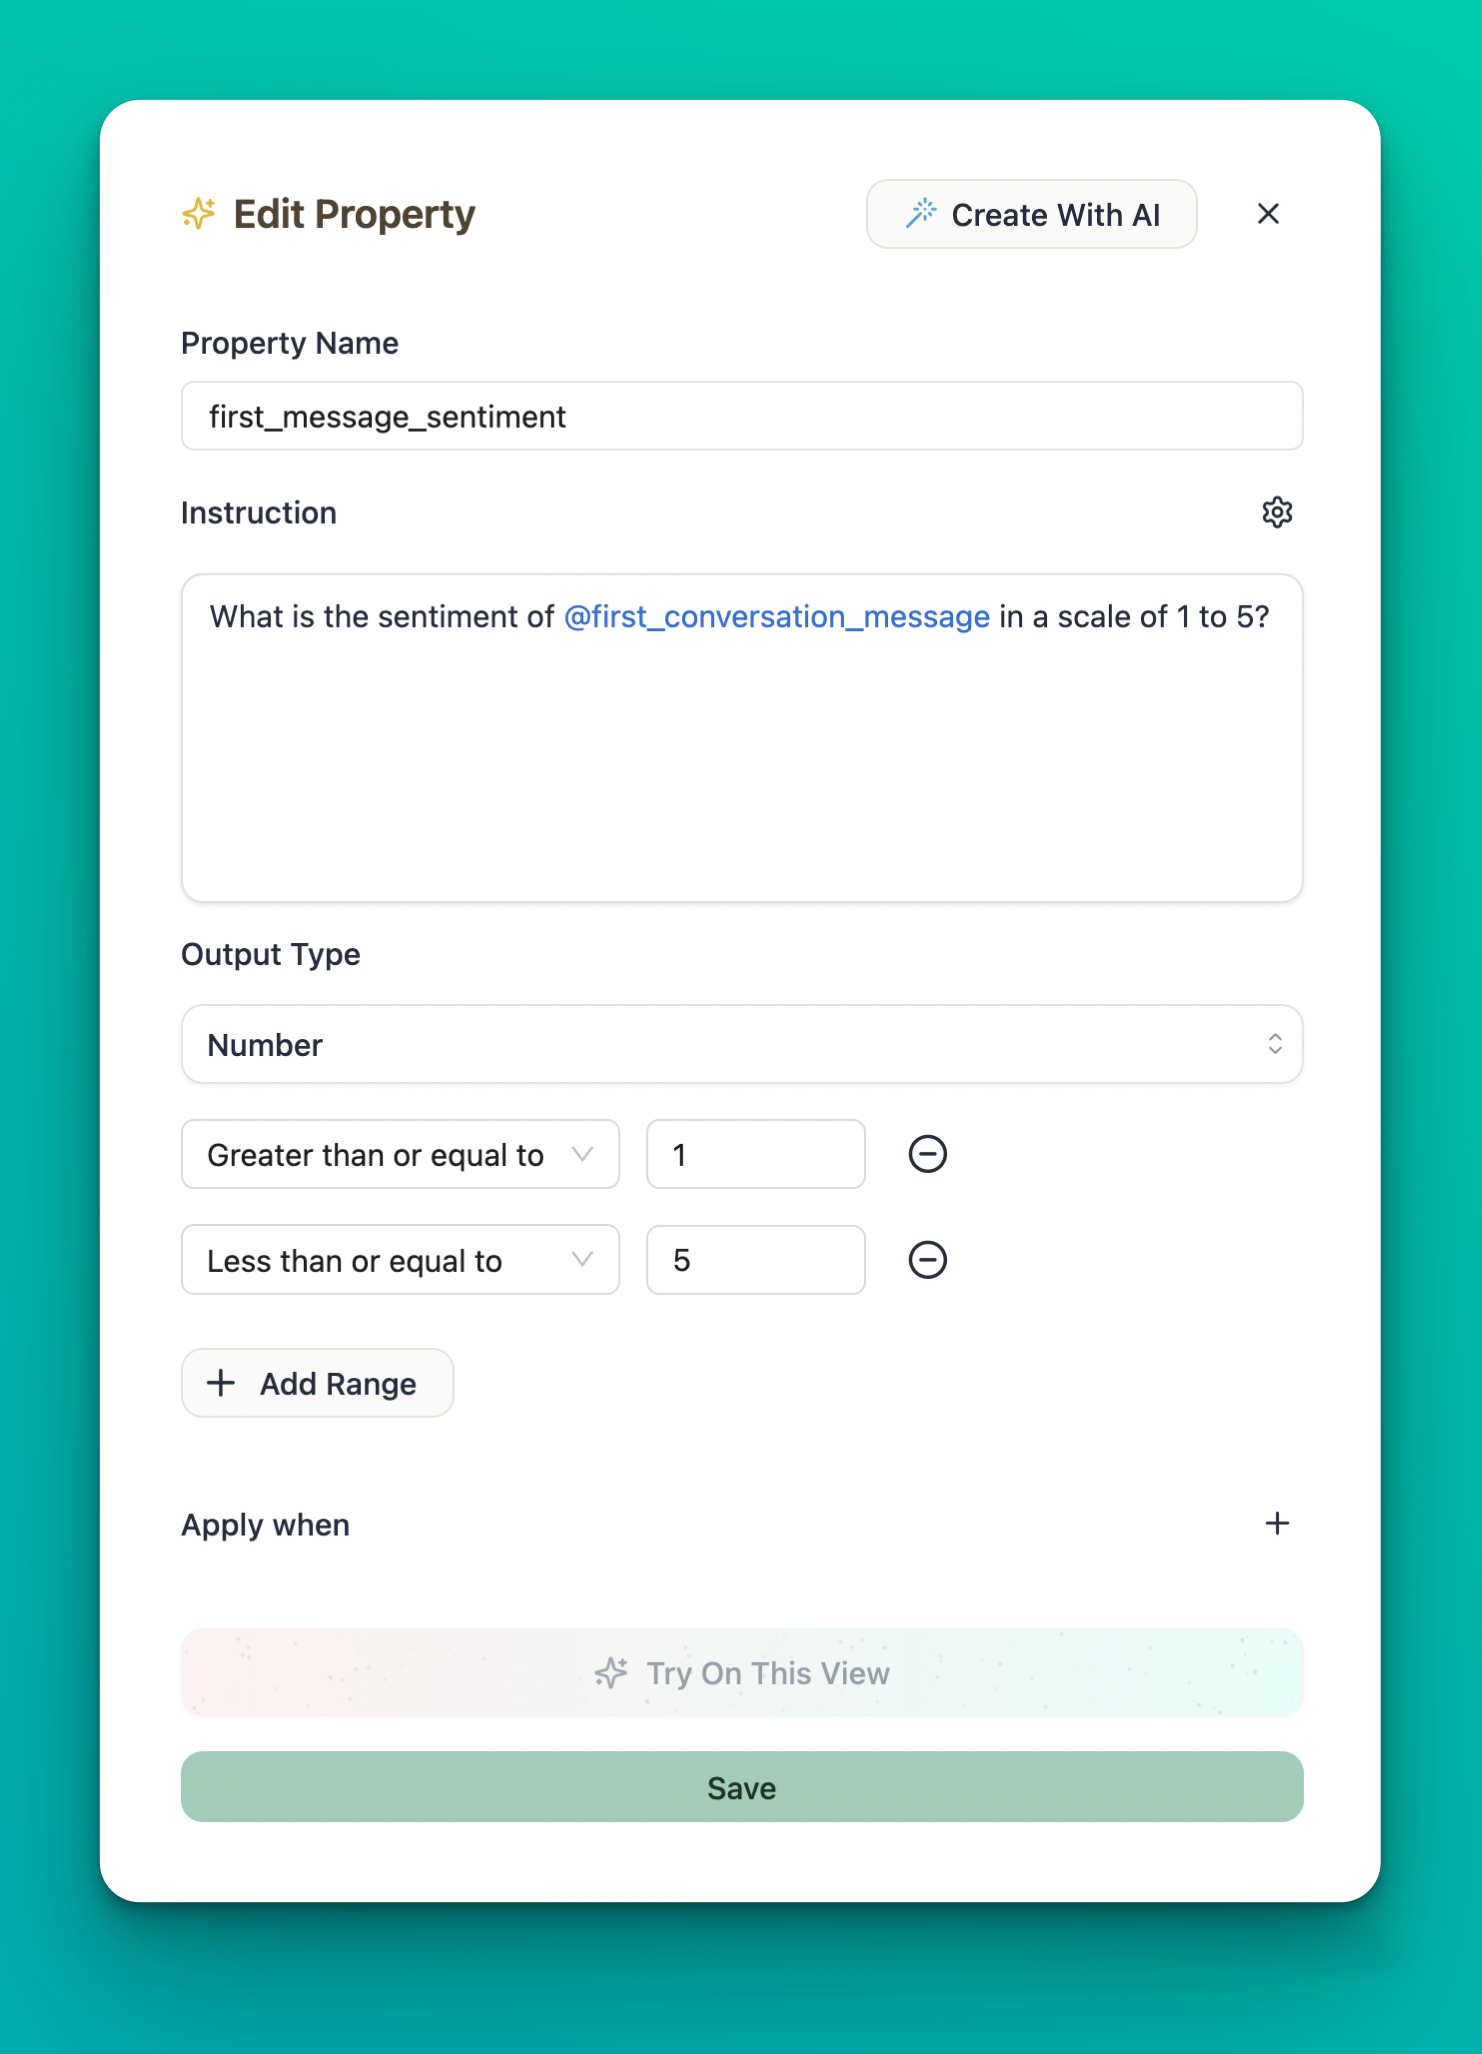
- From your View, click “New Column” and select “Magic”
- Describe what you want to discover using natural language with column references:
- Choose the output type (e.g., “Number”, “Text”, “Boolean”)
- Name your property (e.g., “first_message_sentiment”) and click “Save”
When to Use Magic Properties
// TODO: Write real examples, not LLM-generated Magic Properties are particularly powerful for:- Extracting subjective insights like sentiment, tone, or intent
- Categorizing free-form text into structured categories
- Identifying patterns that would be difficult to express in traditional queries
- Quickly exploring new dimensions of your data without complex setup
Tips for Effective Magic Properties
- Reference existing columns and properties: Use the @ symbol to reference other columns and properties in your data
- Set the Output Type: Choose whether you want the LLM answer in a Yes/No format, numeric value, or custom categories
- Build it up: Properties are designed like Lego blocks. Have a specific question in mind and build up to your insights step by step
- Iterate based on results: Refine your prompts based on the initial outputs
Example Use Cases
- Understanding Churn: Identify where and why users are churning
- Feedback Categorization: Extract recurring themes from user interactions, like feature requests, successful support cases, or spikes in excitement
- User Engagement: Pinpoint which aspects of the product cause confusion, satisfaction, or frustration
Combining Properties for Deeper Insights
Properties become even more powerful when used together. For example: // TODO: Write real examples, not LLM-generated- Create a Calculated Property to extract the first message in each conversation
- Use a Magic Property to analyze the sentiment of those first messages
- Create another Calculated Property to group conversations by sentiment score
- Build charts that visualize how sentiment correlates with other metrics
Example Workflow
1
Extract Data with Calculated Properties
Create a Calculated Property named “first_conversation_message” that extracts the first message in each conversation using the “First Value” aggregation function.
2
Analyze with Magic Properties
Create a Magic Property named “message_sentiment” that analyzes the sentiment of the first message:
3
Categorize with Calculated Properties
Create another Calculated Property named “sentiment_category” that groups conversations:
- 1-2: Negative
- 3: Neutral
- 4-5: Positive
4
Visualize the Results
Create a chart that shows how sentiment correlates with other metrics like conversation length, resolution time, or customer satisfaction.